
Financial Literacy: How The Government Collects And Spends Tax Revenue
Written by: Ken Burke, CPA/PFS CBEC®
In 1913, the Constitution granted Congress the power to lay and collect taxes, duties, imposts, and excises to pay the debts and provide for the common defense and general welfare of the United States. Another term used to describe this authority is the "Taxing and Spending Clause" of the Constitution.
The federal government collects taxes and then decides how to spend these resources. Since we just finished filing and paying taxes, we thought it would be interesting to provide some insights into the finances of the federal government.
Where does the Tax Revenue come from?
 Data Source: Congressional Budget Office, 2023
Individual income tax is the largest source of revenue accounting for 53% of total revenue. Payroll taxes are a close second at 31%. Employers and employees each pay 50% of the total or $750 billion.
What about Corporation Tax? Shouldn’t they be paying more?
In a word, yes; however, we all should be paying more considering our budget deficit. To understand Corporations as taxpayers, we need more context.
“Over 90 percent of businesses in the United States are pass-through businesses, whose income is reported on the business owners’ tax return and is taxed under the individual income tax system. These businesses earn the majority of all business income in the U.S. and employ over half of the private-sector workforce in 49 out of 50 states.” [Source: Tax Foundation]
A portion of Individual Income Tax is really corporation tax in disguise. Further, corporate tax rates are 20% for companies with net income lower than $100 million while the highest individual tax rate is 37%. The government is collecting more tax revenue under this arrangement than if all businesses paid their taxes as a corporation. The combination of disguised corporate tax and 50% of payroll taxes implies businesses/corporations are paying more taxes than represented on the graph.
Where does the Tax Revenue go?

Data Source: Congressional Budget Office, 2023
Mandatory Spending: $4.1 trillion
This category represents payment for benefits programs whose eligibility rules and benefit formulas are set by law. Social Security represents about 50% of the total in this category.
Discretionary Spending: $1.7 trillion
Lawmakers control discretionary spending through annual appropriations. Kay Granger is the current Chairwomen of the House Appropriations Committee.
Non-defense programs account for $910 billion or more than 50% of spending in this category. Health, Education, Training, Employment, Social Services, Veteran Benefits and Transportation are the major Non-defense categories. Defense spending is $751 billion.
Net Interest Spending: $475 billion
The government’s interest payments on debt held by the public, offset by the interest income the government receives.
The Federal Government Financial Condition
If You Give A Mouse A Cookie, by Laura Numeroff:

This children’s story is a funny way to describe the growth of government spending and national debt. It’s the story of a hungry little mouse who shows up at your house looking for something to eat. If you decide to give him a cookie, he’s going to ask for a glass of milk. He’ll want to look in a mirror to make sure he doesn’t have a milk mustache, and then he’ll ask for a pair of scissors to give himself a trim…
The requests for more never end in this funny story. Do you see any similarity with our government’s appetite for taxes and spending?
Operating Results
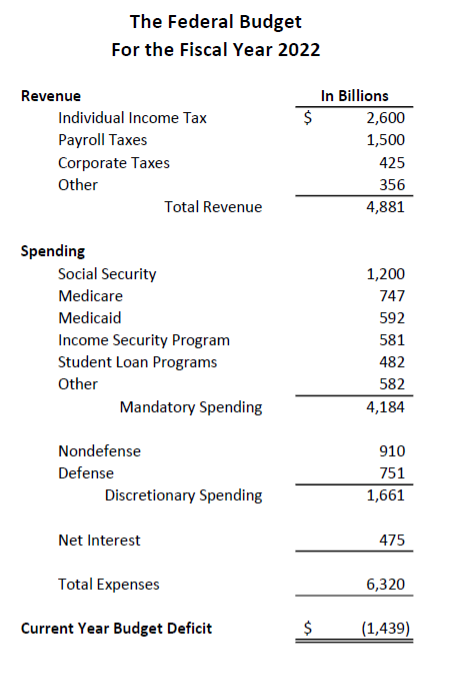 The federal deficit in 2022 was $1.4 trillion, equal to 5.5 percent of gross domestic product and almost 2 percentage points greater than the average over the past 50 years. We have a structural mismatch between spending and revenue which adds to our national debt.
According to the Congressional Budget Office, cumulative deficits over the coming 10 years are projected to be $20.2 trillion. Our national debt will be over $50 trillion! Net interest cost will consume a large portion of our budget diverting resources from the social programs we need.
Even more alarming are the unfunded liabilities of the federal government. According to the American Legislative Exchange Council, the federal government's unfunded liabilities are $167 trillion, over $500 thousand per citizen and $1 million for a married couple. For many retirees, this makes them insolvent, as their liabilities exceed their assets. Unfortunately, no one is truly debt-free in our country.
How should this impact our planning?
- Take advantage of lower tax rates; higher tax rates are coming. Tax rates are at historically low levels at least until the end of 2025 when the Tax Cuts and Jobs Act (TCJA) is set to expire.
- Reposition your financial assets to accounts that are tax-free. A Roth IRA conversion strategy is a potential solution.
- If you are currently working and participating in a 401(k) or 403(b) plan that has a Roth option, redirect your contributions to the Roth account.
- Utilize the “Back Door Roth” strategy on an annual basis.
- Plan for a potential reduction in social benefits. The 2023 Trustees Report project Medicare will be depleted by 2031 and Social Security will be depleted by 2033. Based on current law, Social Security benefits could be cut by 23% if nothing is done to stabilize the program.
Our government’s finances are on an unsustainable path. Eventually, higher taxes and reduced benefits will arrive. You should be proactive to protect your family from this possibility. Don’t wait for the first rain drop to build an ark.
If you would like to discuss strategies to protect your wealth, reduce or possible eliminated taxes in retirement, please contact our office. We are here to help.